make_* functions, Faker for rule-based generation, and GAN-based methods like CTGAN or TabGAN. These are powerful but often complex to set up. TabPFN is a foundation model specialised for tabular data, and its unsupervised tools let us generate a look-alike table without training a GAN or building a simulation.
In this notebook we take an existing dataset (scikit-learn’s Breast Cancer table) as the source, fit TabPFN’s unsupervised model on it, and sample new rows that share its column distributions and correlations. The result is a standalone synthetic table that can stand in for the real one (for a demo, a test fixture, or to extend the training set) which we then compare against the original with a few fidelity plots.
You can use this approach to:
- Realistic demo data to share with customers or collaborators without exposing real records.
- QA and pipeline tests with plausible rows before going live on real data.
- Fast prototyping when access to the real dataset is restricted.
Setup
Installing TabPFN, its extensions, and seaborn. The unsupervised synthetic-data helpers live intabpfn_extensions; seaborn and scikit-learn draw the fidelity plots at the end.
Imports and Data
Loading the Breast Cancer dataset as our safe, realistic table. We use scikit-learn’s Breast Cancer dataset, a classic, non-sensitive table that stands in for whatever proprietary data you would like to synthesise. We keep a train/test split so the synthetic table can later be compared against real data the model never saw.Building the Unsupervised Model
Wrapping a classifier and a regressor intoTabPFNUnsupervisedModel.
The synthetic-data experiment expects a TabPFNUnsupervisedModel, which pairs a TabPFNClassifier (for discrete columns) with a TabPFNRegressor (for continuous columns). Together they let TabPFN model each column conditional on the others and sample new rows from that joint distribution.
Generating the Synthetic Table
Running the experiment to produce look-alike rows.GenerateSyntheticDataExperiment handles the sampling loop. temp controls diversity: higher values give more varied rows, lower values stay closer to the training data. n_samples sets how many rows we want out. Here we ask for twice as many rows as the training split, over all 30 features. Inputs come in as tensors, and the resulting synthetic table is written to synthetic.csv for the evaluation step.
Comparing Real vs. Synthetic

Checking fidelity on three levels. A synthetic table is only useful if it behaves like the real thing. We compare the two side by side on three levels: the distribution of each column, the correlation structure between columns, and the low-dimensional geometry of the rows. The real side is the held-out test split, rows the generator never saw, so a good match is not just memorization. The plots use pandas, seaborn, and scikit-learn only, so nothing extra needs to be installed.Distributions
Do the synthetic columns look like the real ones? The per-feature density curves show how closely each synthetic column tracks the real distribution. A close overlap means the marginals have been preserved.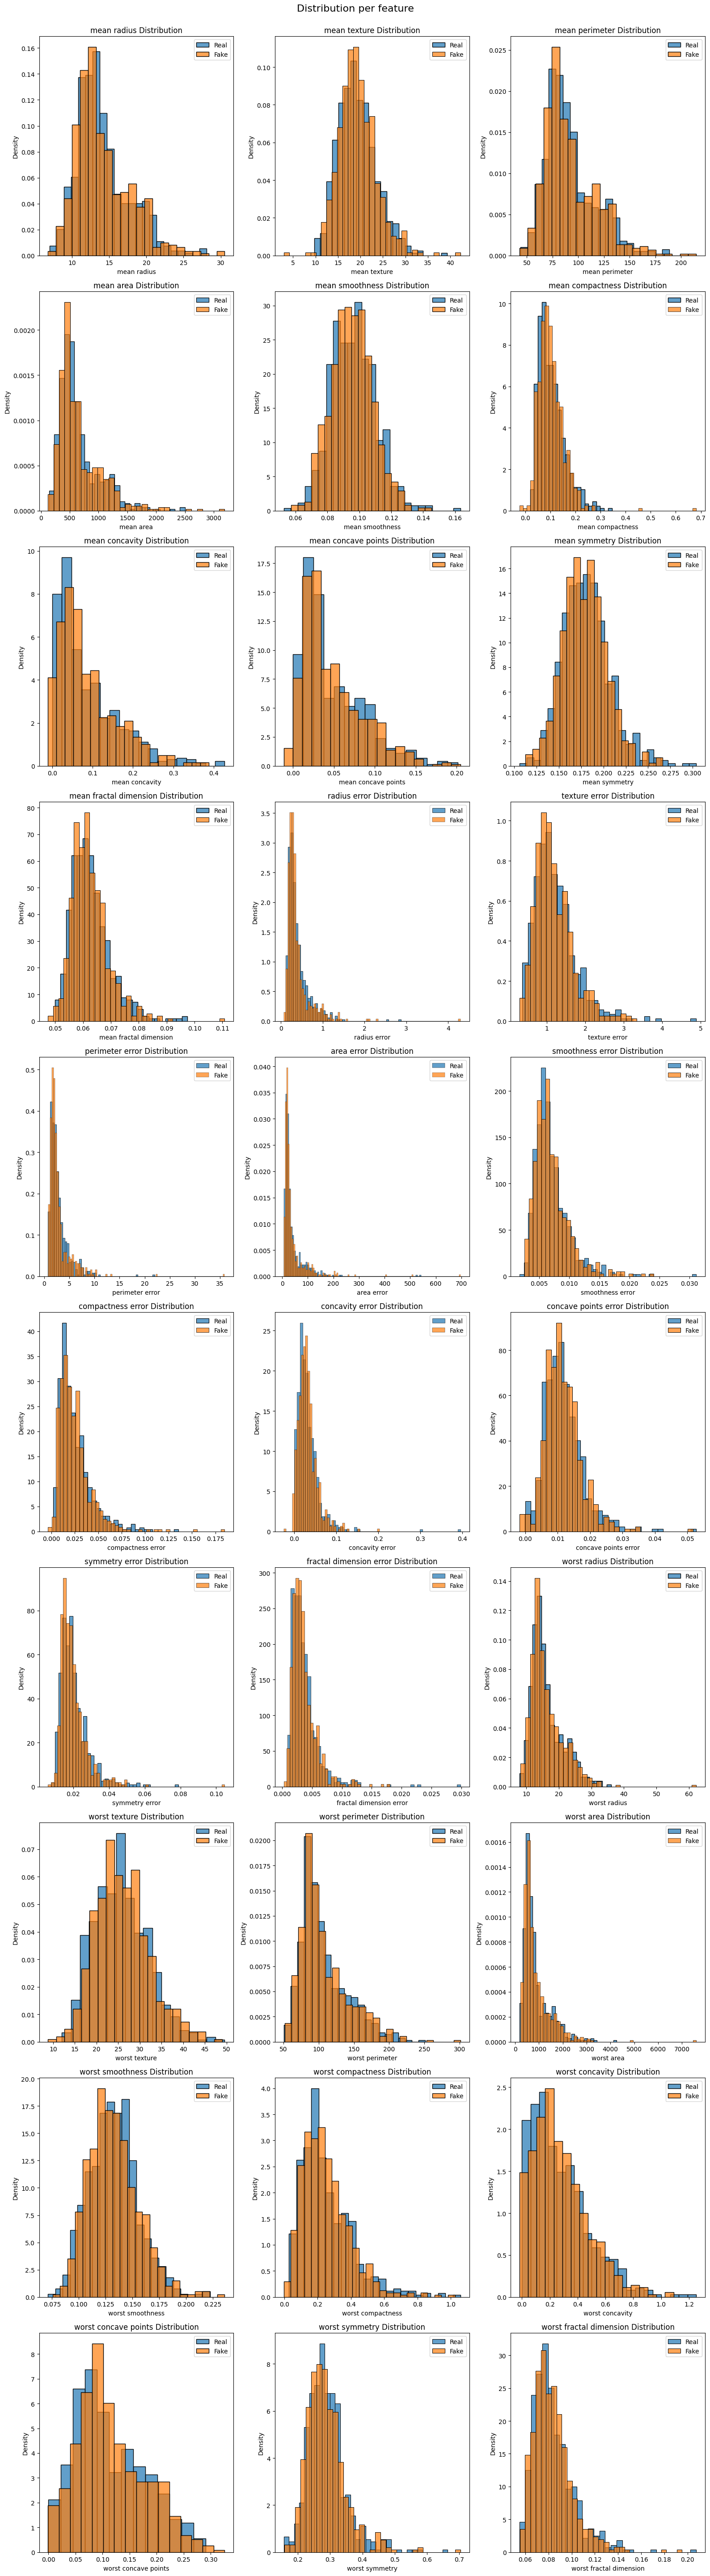
Correlations
Are the relationships between features still there? TabPFN samples each column conditional on the others, so we care about more than just marginals. The correlation-difference heatmap highlights where the synthetic table’s feature-to-feature relationships depart from the real table. Small values mean the joint structure held up.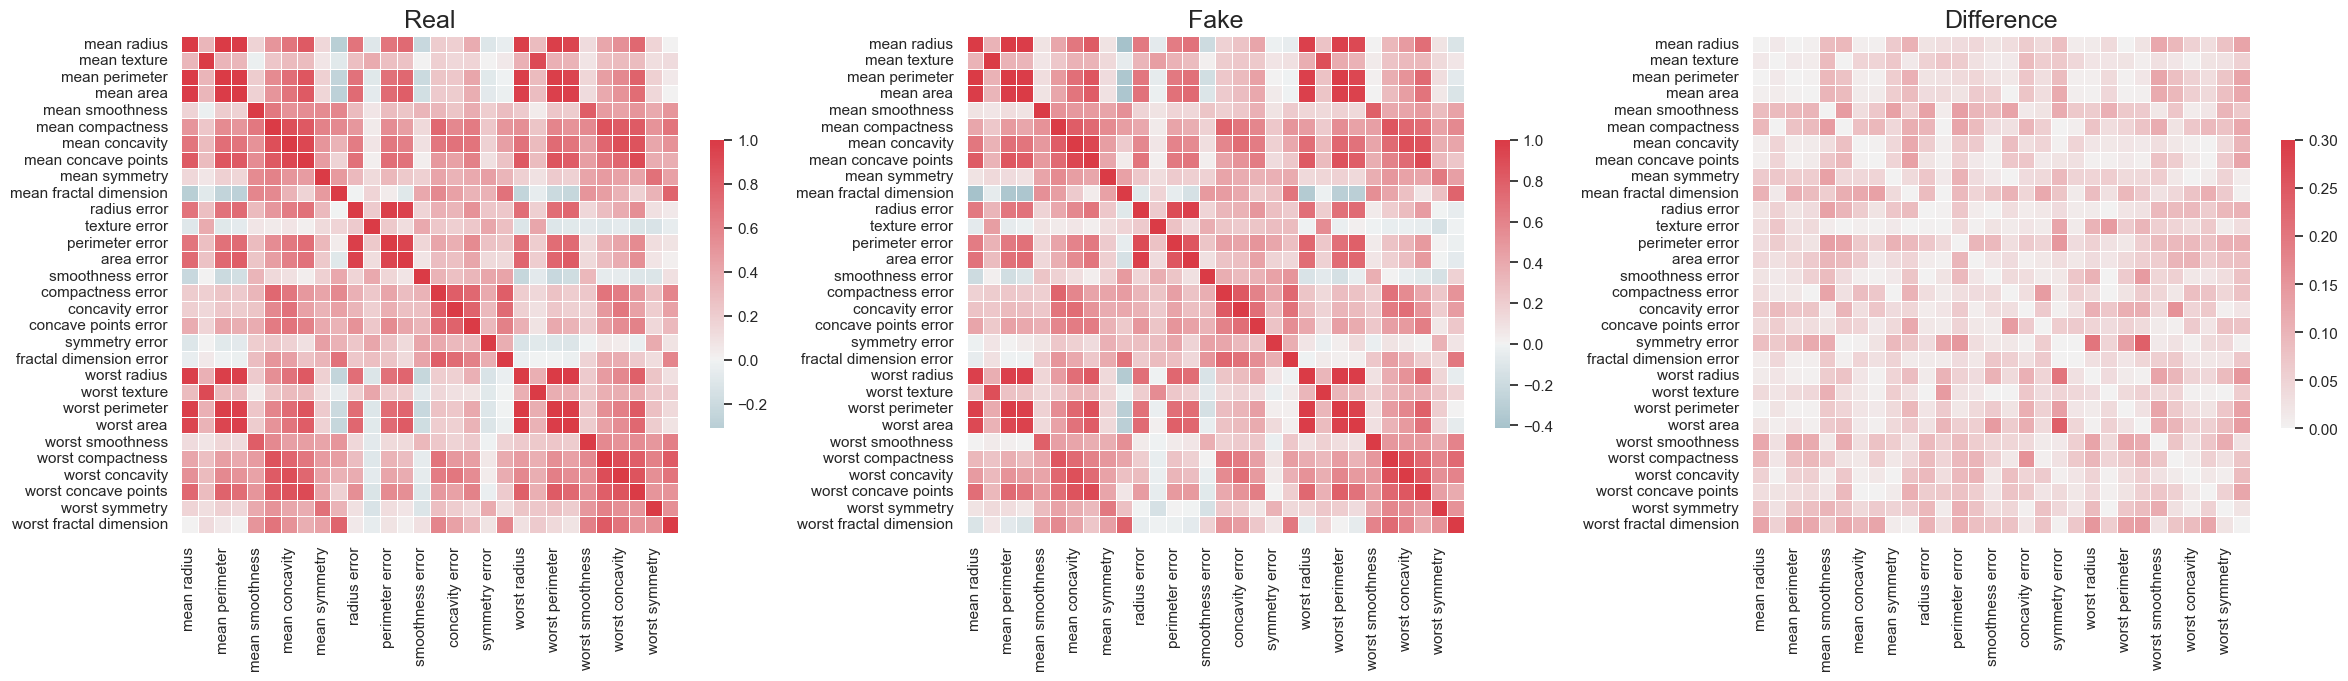
PCA Projection
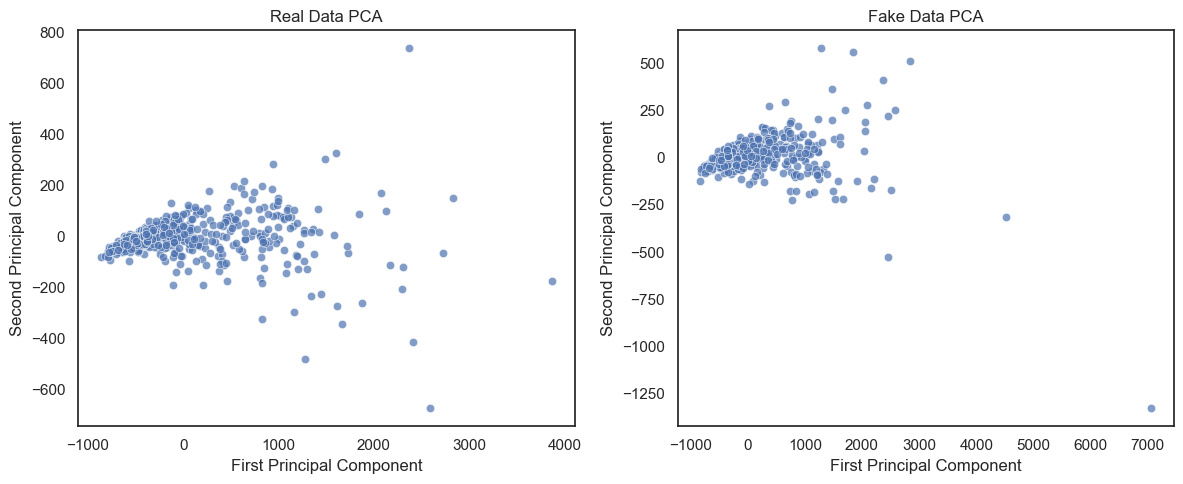
Do the two tables share the same low-dimensional geometry? We standardize the features and fit a two-component PCA on the real table, then project both tables onto it. Overlapping clouds mean the synthetic rows live in the same subspace as the real ones. A few synthetic rows land far outside the real cloud: the sampler occasionally extrapolates, which is worth checking for before using the table downstream.