def evaluate(y_true, probabilities):
    return {
        "ROC AUC": roc_auc_score(y_true, probabilities),
        "Brier": brier_score_loss(y_true, probabilities),
    }


def plot_ranking(y_true, predictions):
    fig, ax = plt.subplots(figsize=(6, 4.5), layout="constrained")
    for name, probabilities in predictions.items():
        fpr, tpr, _ = roc_curve(y_true, probabilities)
        ax.plot(
            fpr, tpr, color=colors[name], linewidth=2.5,
            label=f"{name} · AUC {roc_auc_score(y_true, probabilities):.4f}",
        )
    ax.plot([0, 1], [0, 1], "--", color="#CCD2DC", label="Random ranking")
    ax.set(title="ROC", xlabel="False positive rate", ylabel="True positive rate",
           xlim=(-0.02, 1.02), ylim=(-0.02, 1.02))
    ax.grid(color="#EEF0F4")
    ax.legend(fontsize=9, loc="lower right")
    plt.show()


def plot_metric_comparison(results, title):
    fig, axes = plt.subplots(1, 2, figsize=(8, 3.5), layout="constrained")
    for ax, metric in zip(axes, ["ROC AUC", "Brier"]):
        values = results[metric]
        bars = ax.bar(values.index, values, color=[colors[name] for name in values.index], width=0.55)
        ax.bar_label(bars, fmt="%.4f" if metric == "ROC AUC" else "%.3f", padding=5, fontsize=11)
        higher_is_better = metric == "ROC AUC"
        ax.set_title(metric + (" ↑" if higher_is_better else " ↓"))
        ax.set_ylim(0, 1.15 if higher_is_better else values.max() * 1.3)
        ax.set_axisbelow(True)
        ax.grid(axis="y", color="#EEF0F4")
    fig.suptitle(
        title,
        color=colors["TabPFN Plus"], fontsize=13, fontweight="bold",
    )
    plt.show()


def show_calibration(y_true, predictions):
    bin_edges = np.linspace(0, 1, 6)

    fig, axes = plt.subplots(
        1, len(predictions), figsize=(4.5 * len(predictions), 4.5),
        squeeze=False, layout="constrained",
    )
    for ax, (name, probabilities) in zip(axes.flat, predictions.items()):
        color = colors[name.split(" · ", 1)[0]]
        data = pd.DataFrame({"predicted": probabilities, "fraud": np.asarray(y_true)})
        data["bin"] = pd.cut(data["predicted"], bins=bin_edges, include_lowest=True)
        points = data.groupby("bin", observed=True).agg(
            predicted=("predicted", "mean"),
            observed=("fraud", "mean"),
            count=("fraud", "size"),
        )

        # Wilson intervals for the observed fraud rate in each bin.
        count = points["count"].to_numpy()
        rate = points["observed"].to_numpy()
        z = 1.96
        denominator = 1 + z**2 / count
        center = (rate + z**2 / (2 * count)) / denominator
        half_width = z * np.sqrt(rate * (1 - rate) / count + z**2 / (4 * count**2)) / denominator
        errors = np.maximum(0, [rate - (center - half_width), center + half_width - rate])

        ax.plot([0, 1], [0, 1], "--", color="#B9C1CE", label="Perfect calibration")
        ax.errorbar(
            points["predicted"], rate, yerr=errors, fmt="o", color=color,
            capsize=4, markersize=6, linewidth=1.5,
        )
        for predicted, observed, size in zip(points["predicted"], rate, count):
            ax.annotate(
                f"n={size}", (predicted, observed), textcoords="offset points",
                xytext=(-8 if predicted > 0.85 else 8,
                        -30 if observed > 0.9 and predicted > 0.85 else (-15 if observed > 0.9 else 10)),
                ha="right" if predicted > 0.85 else "left", fontsize=9,
            )
        ax.set(title=name, xlabel="Mean predicted fraud probability",
               ylabel="Observed fraud rate", xlim=(-0.05, 1.05), ylim=(-0.06, 1.08))
        ax.set_aspect("equal", adjustable="box")
        ax.grid(color="#EEF0F4")
    axes.flat[0].legend(loc="upper left", fontsize=9)
    plt.show()

    risk_summary = pd.DataFrame([
        {"Model": name, "Mean predicted risk": np.mean(probabilities),
         "Observed fraud rate": y_true.mean(), "Brier": brier_score_loss(y_true, probabilities)}
        for name, probabilities in predictions.items()
    ]).set_index("Model")
    risk_summary_display = risk_summary.copy()
    for column, format_string in {
        "Mean predicted risk": "{:.1%}", "Observed fraud rate": "{:.1%}", "Brier": "{:.3f}",
    }.items():
        risk_summary_display[column] = risk_summary[column].map(format_string.format)
    display(risk_summary_display)

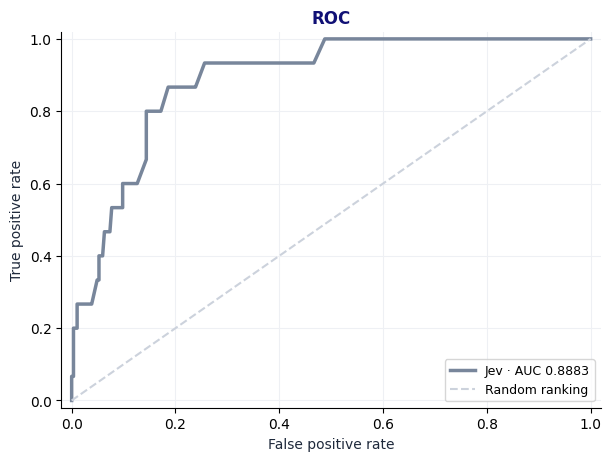 Jev reaches ROC AUC 0.8883 from 44 examples. It ranks fraud above legitimate postings better than random. Its Brier score is 0.101; the calibration plots below check whether its probability values match the observed fraud rates.
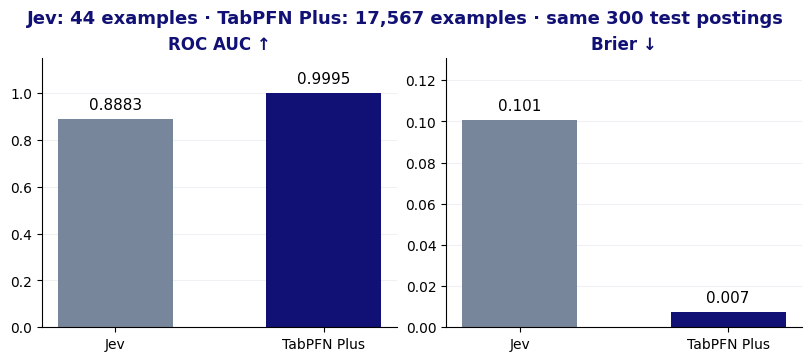
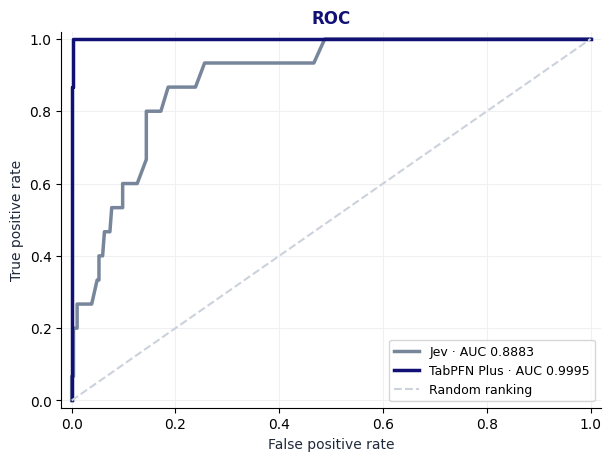 With all available training data, TabPFN reaches ROC AUC 0.9995, compared with 0.8883 for Jev. Brier is 0.007 versus 0.101; lower means smaller probability errors across the test postings.
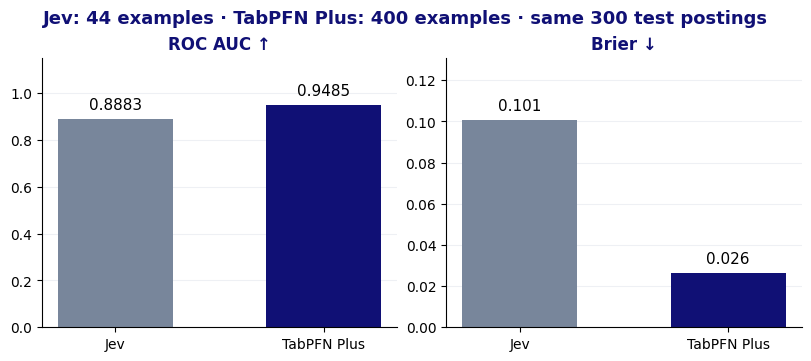
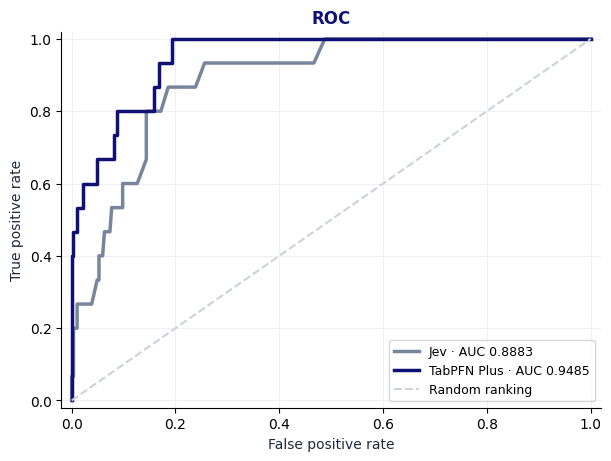 With 400 training rows, TabPFN reaches ROC AUC 0.9485, versus 0.8883 for Jev with 44 examples. Brier is 0.026 versus 0.101; lower means smaller probability errors.
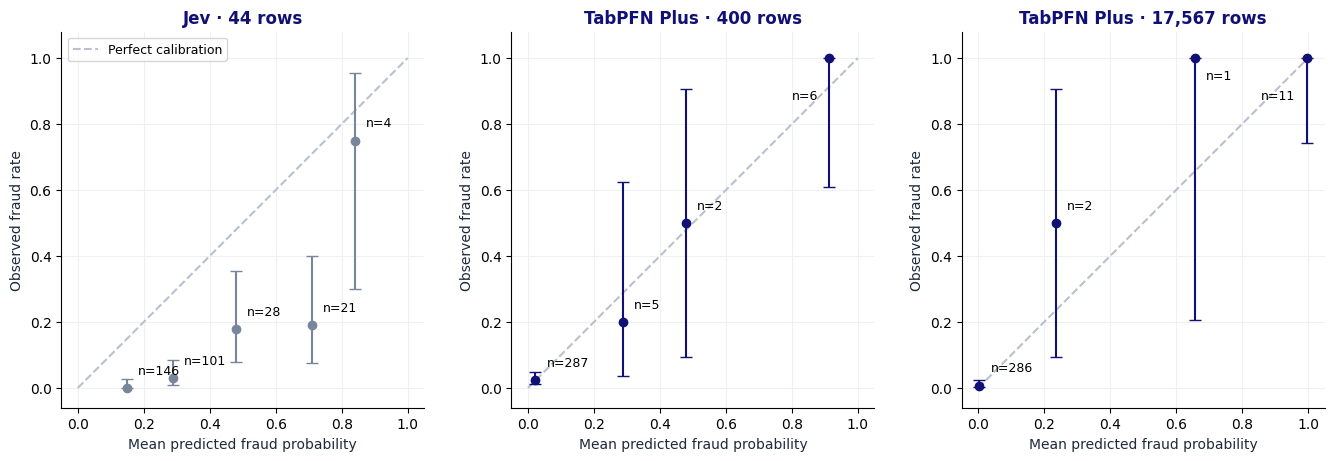 As we can see, Jev systematically overestimates risk - mean predicted risk is 27.5%, while 5.0% of postings are fraudulent. Among the 21 postings it assigns 60–80% risk, only 4 are fraud. This basically means that if you were using Jev for decision-making, the agent would ban more innocent posts than fraudulent - and we can predict (pun intended) that your users won’t be happy about that.
TabPFN’s mean predicted risks are 4.8% with 400 training rows and 4.4% with the full training set. On the contrast with Jev, TabPFN does not blanket-ban innocent postings - and that means happier users and less support requests to your team (even if the team is agentic!)
As we can see, Jev systematically overestimates risk - mean predicted risk is 27.5%, while 5.0% of postings are fraudulent. Among the 21 postings it assigns 60–80% risk, only 4 are fraud. This basically means that if you were using Jev for decision-making, the agent would ban more innocent posts than fraudulent - and we can predict (pun intended) that your users won’t be happy about that.
TabPFN’s mean predicted risks are 4.8% with 400 training rows and 4.4% with the full training set. On the contrast with Jev, TabPFN does not blanket-ban innocent postings - and that means happier users and less support requests to your team (even if the team is agentic!)