What is grouped data?
Grouped data is not IID (Independent and Identically Distributed). It has an underlying structure: data groups or clusters. For example, datasets could contain multiple observations for a patient. In this example, we will study experimental data from 72 different mice. Each mouse has 15 observations. This makes it grouped data. Two observations of the same mouse are not the same as two observations from different mice. This also affects the evaluation of Machine Learning models. We want a model that accurately predicts data for unseen groups (here, unseen mice). We then have to test TabPFN on mice groups that were not seen in the training/context set.The problem: predict a mouse’s experimental class
The Mice Protein Expression dataset contains protein measurements from 72 mice, with 15 rows per mouse. We predict which of eight experimental classes each mouse belongs to. Although these labels are already known, predicting them tests whether the proteins reveal patterns linked to learning and treatment in a mouse model of Down syndrome. All 15 rows from a mouse share the same target label; keeping them as separate examples evaluates how well each protein measurement predicts that label. The classes combine mouse type, a learning task or comparison condition, and treatment with saline or the drug memantine. Trisomy mice model Down syndrome;CS denotes the learning task and SC the comparison condition.
We compare TabPFN 3, TabPFN 3.5, and XGBoost on the same held-out mice,
then try Thinking mode. Each mouse is a group; several mice share a class.
Setup
Install the pinned client and dependencies. TabPFN runs through the API; XGBoost runs on CPU. Authenticate with your usual TabPFN client setup before running the comparison.Load the curated dataset and its splits
The Beyond Arena collection includes the data and explicit train/test row indices. Pinning the collection revision makes these splits reproducible. The mice task is1273313252 (mice_protein_trisomy_discriminant), derived from
UCI Mice Protein Expression, licensed CC BY 4.0.
The curation removes the three columns that directly define the target and
reduces MouseID to the actual animal identifier. This lets the split keep
all measurements from the same animal together.
Check that the split matches deployment
Use the three folds of the first grouped repetition. Each fold trains on 48 mice (720 measurements) and tests on 24 other mice (360 measurements). The assertions below check that neither row indices nor mouse identifiers overlap between training and test data. This evaluation asks how well the model predicts experimental classes for new animals. If the intended use were another measurement from an animal already seen during training, that would call for a different evaluation. Choose the group at the level where generalization matters; for example, holding out patients answers a different question from holding out hospitals.Compare the three models
Use protein measurements as predictors and omitMouseID. Thinking receives
the original group column below to guide its internal validation. Preserve
missing values and encode categorical columns with levels learned from the
training rows; unseen test categories become missing for every model.
Both TabPFN versions keep their default estimator count and random state.
XGBoost uses a fixed CPU histogram configuration: 500 trees, depth 4, and a
learning rate of 0.05. There is no test-set tuning or class resampling.
Use multiclass log-loss (lower is better), matching the selected Thinking
objective. It scores the probability assigned to the correct class and
penalizes confident mistakes more strongly. This comparison uses simple
preprocessing, rather than reproducing the collection’s tuned baselines.
Unseen mice
Each test fold contains 24 animals, with 15 measurements per animal. Log-loss is averaged over measurements; because each animal has the same number of measurements, each animal has equal weight. The three folds are the evaluation units, not 1,080 independent animals.Performance on grouped data
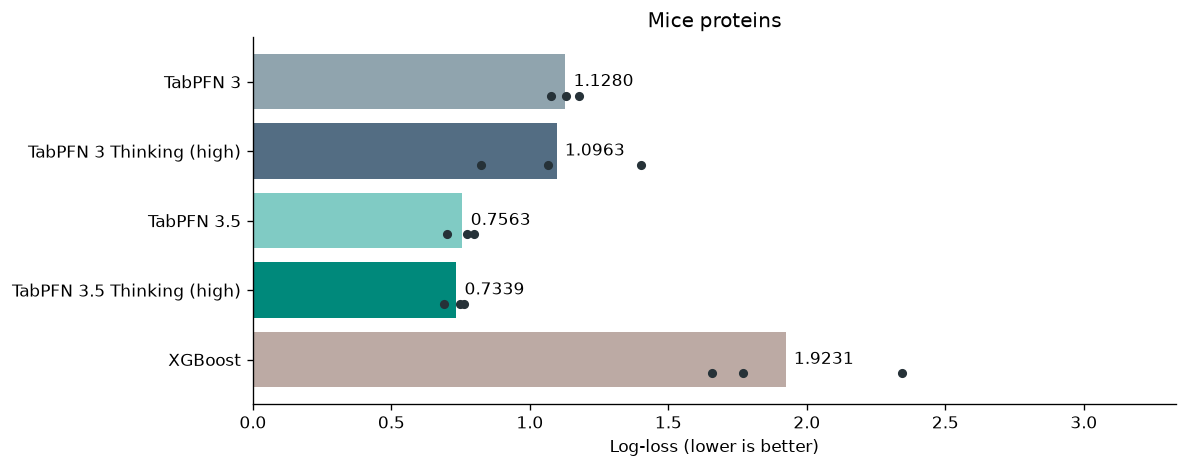
The table shows mean log-loss across the three grouped splits. Lower is better. Keep the individual fold scores above in view: the held-out mice change between folds, so performance varies with which animals are unseen.Try high-effort Thinking
Thinking mode spends more computation duringfit() searching model configurations. Set
thinking_effort="high" and choose thinking_metric="log_loss" before
fitting. Use predict_proba() to evaluate the resulting probabilities.
Run the same splits with the same training rows and preprocessing. Only
training labels are passed to fit(); held-out labels are used for scoring.
Pass group_col="MouseID" to keep animals together in Thinking’s internal
validation, preserving the original identifiers in both training and test
frames. Standard models omit this column.
There are two places to respect groups: the outer split measures
performance on unseen mice, while internal validation helps Thinking
choose a configuration using only the training mice. Setting group_col
does not replace the outer split; both must keep each animal’s measurements
together.
Does Thinking improve held-out performance?
Compare each version with its standard counterpart using log-loss. Bars show the three-split mean and dots show individual splits; the dots are descriptive, not confidence intervals. XGBoost remains the fixed CPU baseline.