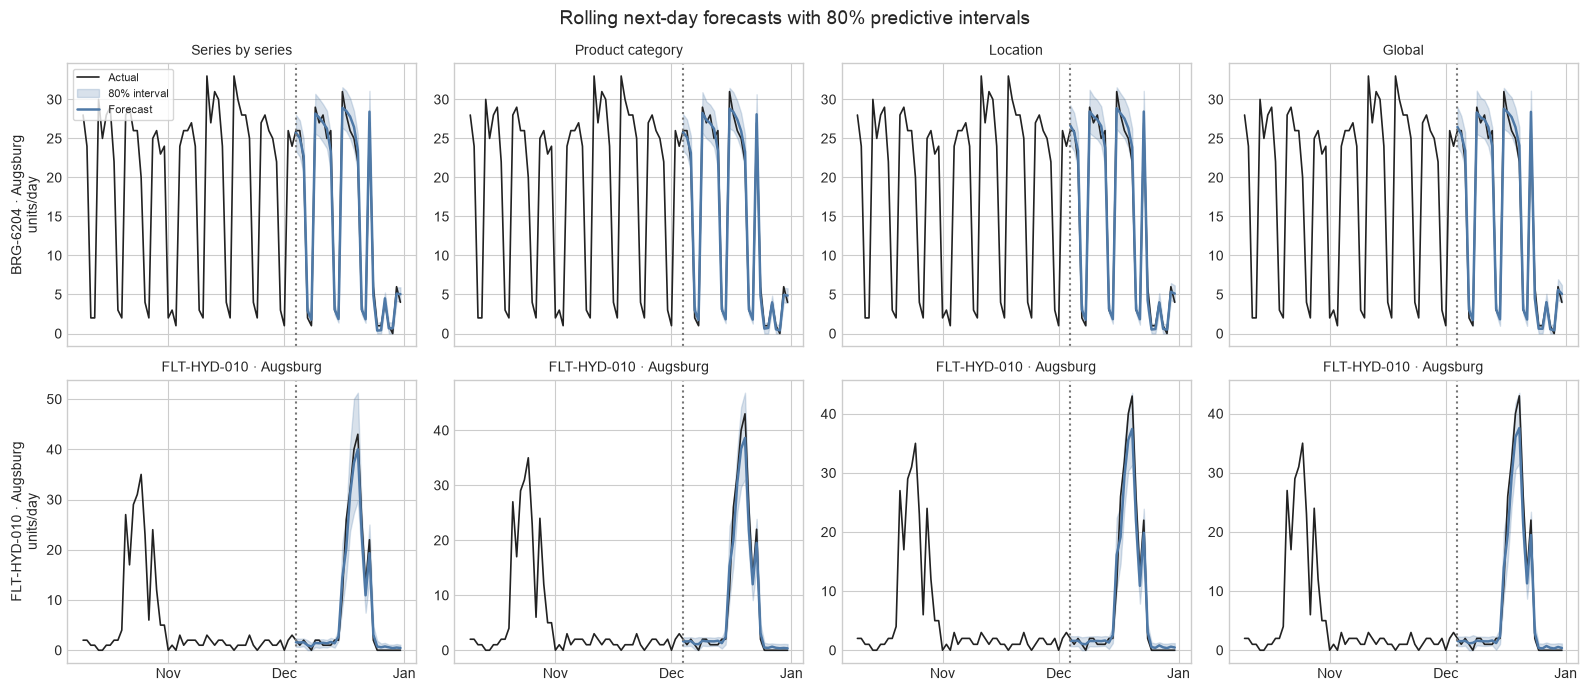
plot_series = ["BRG-6204 · Augsburg", "FLT-HYD-010 · Augsburg"]
strategies = ["Series by series", "Product category", "Location", "Global"]
fig, axes = plt.subplots(len(plot_series), len(strategies), figsize=(16, 7), sharex=True)
for row, series_id in enumerate(plot_series):
    actual = panel[(panel["series_id"] == series_id) & (panel["date"] >= cutoff - pd.Timedelta(days=55))]
    for column, strategy in enumerate(strategies):
        ax = axes[row, column]
        forecast = predictions[(predictions["series_id"] == series_id) & (predictions["strategy"] == strategy)]
        ax.plot(actual["date"], actual["demand"], color="#222222", linewidth=1.2, label="Actual")
        ax.fill_between(forecast["date"], forecast["lower"], forecast["upper"], color="#4E79A7", alpha=0.22, label="80% interval")
        ax.plot(forecast["date"], forecast["prediction"], color="#4E79A7", linewidth=1.8, label="Forecast")
        ax.axvline(cutoff, color="#777777", linestyle=":")
        ax.xaxis.set_major_locator(mdates.MonthLocator())
        ax.xaxis.set_major_formatter(mdates.DateFormatter("%b"))
        ax.set_title(strategy if row == 0 else series_id, fontsize=10)
        if column == 0:
            ax.set_ylabel(f"{series_id}\nunits/day")
axes[0, 0].legend(frameon=True, fontsize=8, loc="upper left")
fig.suptitle("Rolling next-day forecasts with 80% predictive intervals", fontsize=14)
fig.tight_layout()
plt.show()