
Setup
Install the client, XGBoost and the other dependencies. In Colab, addTABPFN_TOKEN to Secrets; elsewhere, use your usual client authentication.
The data
We use the BeyondArena copy of the Kaggle training set: 200,000 customers, a binary target, and 200 anonymized numeric features. BeyondArena adds two indicator columns per feature that encode whether a value is unique in the dataset, a pattern the competition’s top entries relied on, which brings the width to 600 columns. The features have no names and no documented meaning, so there is nothing to engineer by hand. Because the features are anonymized, we compare the models without domain-specific feature engineering. BeyondArena publishes fixed splits. We take the first fold of the first repetition: 133,333 customers to train on and 66,667 held out. Credit: Santander Bank via Kaggle, used under the competition rules.What to measure
A campaign does not act on the whole ranking. It contacts the top of it, down to a budget, so we evaluate every model at four selected campaign budgets: the top 1%, 5%, 10% and 20% of customers. At each budget we report:- Customers contacted and transactors captured, as counts.
- Precision: the share of contacted customers who transact.
- Lift: precision divided by the 10% base rate, that is, how many times better the list does than contacting customers at random.
- Net value of the simulated campaign, under the cost and value assumptions set further down.
TabPFN-3.5
Every TabPFN model in this notebook is pinned to TabPFN-3.5 withcreate_default_for_version, so TabPFN-3.5 and TabPFN-3.5-Thinking share the same checkpoint
and a change in the API’s default model does not change the comparison.
On the API the fit itself takes a few seconds; the time
below is mostly uploading 133,000 rows.
Baseline: XGBoost
We include XGBoost as a conventional tabular baseline. We use shallow trees and a small learning rate, settings that suit many weak, independent features, and fit once with them fixed. Nothing is tuned on the held-out customers, so the comparison stays fair.TabPFN-3.5-Thinking with two objectives
Thinking mode changes what happens at fit time. Instead of a single forward pass, the server runs an optimization over the training data against the metric named inthinking_metric, then serves the result for every later prediction. We compare
roc_auc with average_precision to test whether optimizing for the top of the
ranking improves small campaigns. "roc_auc" rewards a good ranking everywhere in
the list; "average_precision" rewards getting the top of the list right, which is
the only part a small campaign ever sees.
We fit one model for each objective using the same “micro” effort level. thinking_effort controls the fit-time optimization budget; available levels depend on the client version and account access. On this dataset, each “micro” fit takes approximately 5 minutes.
Ranking quality
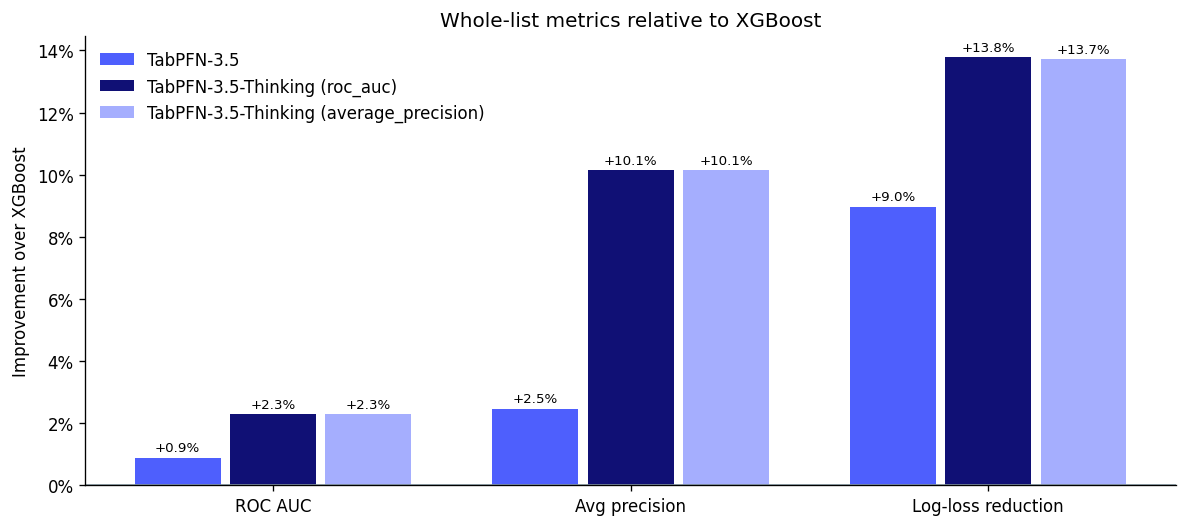 Both TabPFN-3.5-Thinking objectives produce the same whole-list results: ROC AUC 0.9074 and average precision 0.6477, compared with 0.8951 and 0.6025 for TabPFN-3.5. XGBoost trails all TabPFN variants, with ROC AUC 0.8872 and average precision 0.5880. Relative to TabPFN-3.5, TabPFN-3.5-Thinking increases average precision from 0.6025 to 0.6477.
Campaign assumptions
To turn a ranking into money we need two numbers, both set in the cell below:- Value per transaction: what one transaction is worth to the bank. Default €100.
- Cost per contact: what one call, email or mailing costs. Default €2.
The value of following TabPFN-3.5-Thinking
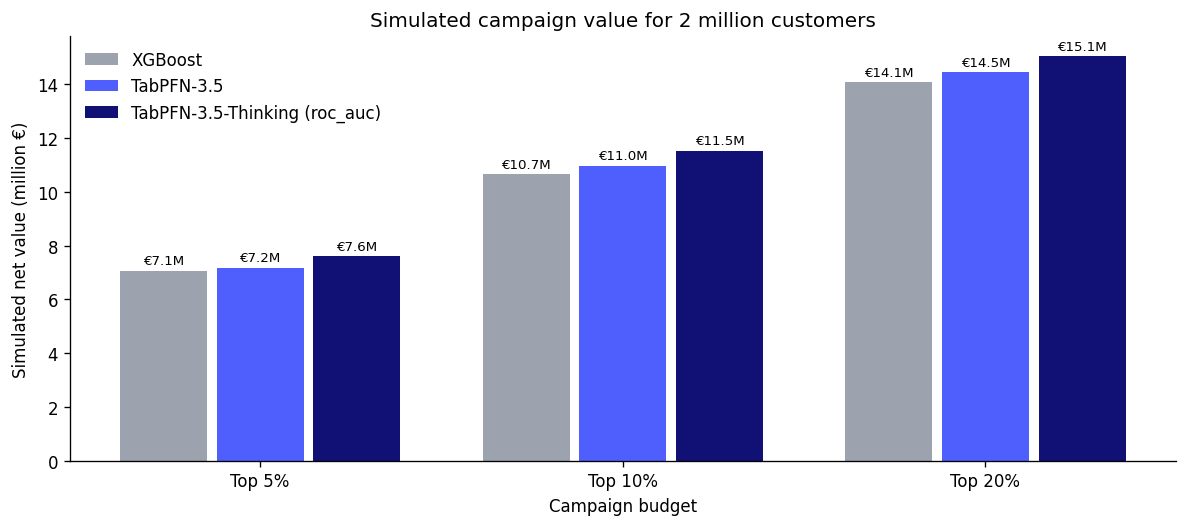
What does the better ranking add up to? Each bar shows simulated net-value uplift relative to XGBoost at the same campaign budget: how much more a campaign that contacts the top of the model’s list is worth than the same campaign run from XGBoost’s list. We use the ROC AUC run of TabPFN-3.5-Thinking; the average precision run is within a few transactors of it. TabPFN-3.5-Thinking’s campaign is worth 6.8–8.1% more than XGBoost’s at the 5%, 10% and 20% budgets, compared with 1.7–2.9% for TabPFN-3.5. At the top 20% that is €501,734 against €469,734 for XGBoost. These figures cover the 66,667 held-out customers, a third of the customer base, and assume the same €100 value and €2 cost per contact as above.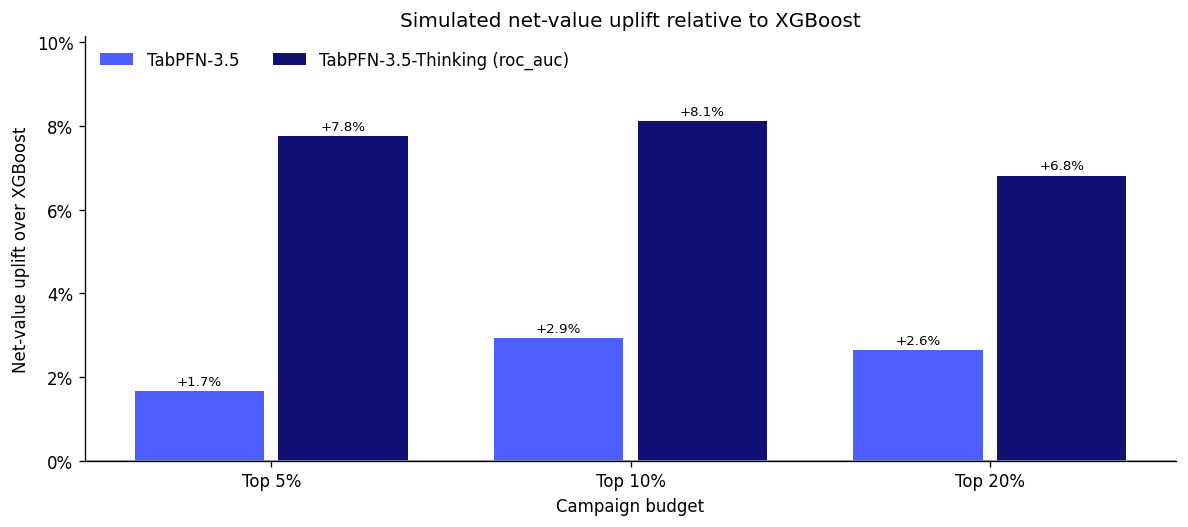 To illustrate why even a relatively small model improvement can matter at scale, we
extrapolate the held-out results to a portfolio of two million customers. Under the
same assumptions, TabPFN-3.5-Thinking would generate approximately €867,000 more
simulated net value than XGBoost at a 10% campaign budget. The extrapolation is
linear: it assumes the wider portfolio looks like the held-out customers.
What this means for targeting
TabPFN-3.5-Thinking captures more transactors and produces the highest simulated net value at all four tested campaign budgets. At a 10% budget, it produces €384,666 on the 66,667 held-out customers: €18,500 more than TabPFN-3.5 and €28,900 more than XGBoost. The Thinking objective makes little practical difference in this experiment. Optimizing ROC AUC or average precision changes the number of captured transactors by no more than 13 at any tested budget. Here, most of the improvement comes from using Thinking rather than selecting between these two objectives. At larger scale, a small per-customer improvement can become material. If the held-out results scaled linearly to two million customers, the 10% campaign would produce approximately €867,000 more simulated value with Thinking than with XGBoost. This extrapolation assumes the same transaction rate, model performance, €100 transaction value, and €2 contact cost. It is a propensity-based simulation, not an estimate of causal campaign impact.Takeaways
- TabPFN-3.5-Thinking produces the highest simulated campaign value at every tested budget.
- At a 10% budget, Thinking adds €18,500 over TabPFN-3.5 and €28,900 over XGBoost on the held-out customers.
- Under the same assumptions, the advantage over XGBoost would correspond to approximately €867,000 across a two-million-customer portfolio.
- ROC AUC and average-precision optimization give nearly identical results here; enabling Thinking matters more than choosing between the two objectives.